Modern Load Test
The on-demand nature of the AWS Cloud allows for a production-scale test environment to be deployed in a matter of minutes.
While AWS serverless services allow for efficient scaling individually, it is important to consider the effect of Service Quotas at both region and account level. Ignoring these maximum limits can become immediately impactful to a production workload.
In this section we will perform load testing on our deployed Blue Car application to ensure that the architecture scales in alignment to the traffic which is being processed.
3.1. Get the API Invoke URL and Auth Token.
Within our example application, the map is used to request an ambulance. At the point that the selection is made, an HTTPS POST method will be sent to the API with latitude and longitude details. In order to perform an appropriate load test, we will need to ensure that access to the API is authorized. To authorize the API, you will need to generate an authorization token within Amazon Cognito, which will allow for automated load testing.
Complete the following steps:
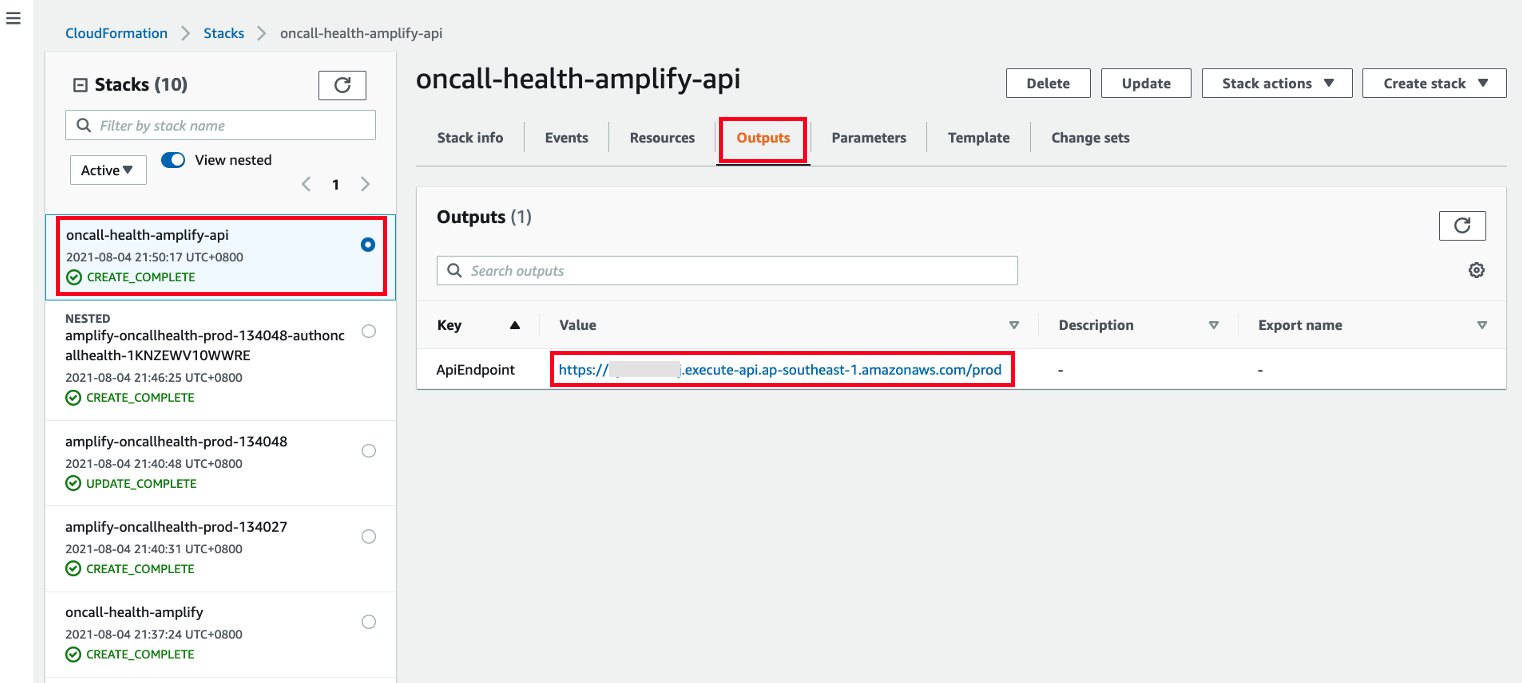
- Open the CloudFormation console at https://console.aws.amazon.com/cloudformation and click oncall-health-amplify-api stack on the left panel. Click Output and copy the ApiEndpoint.
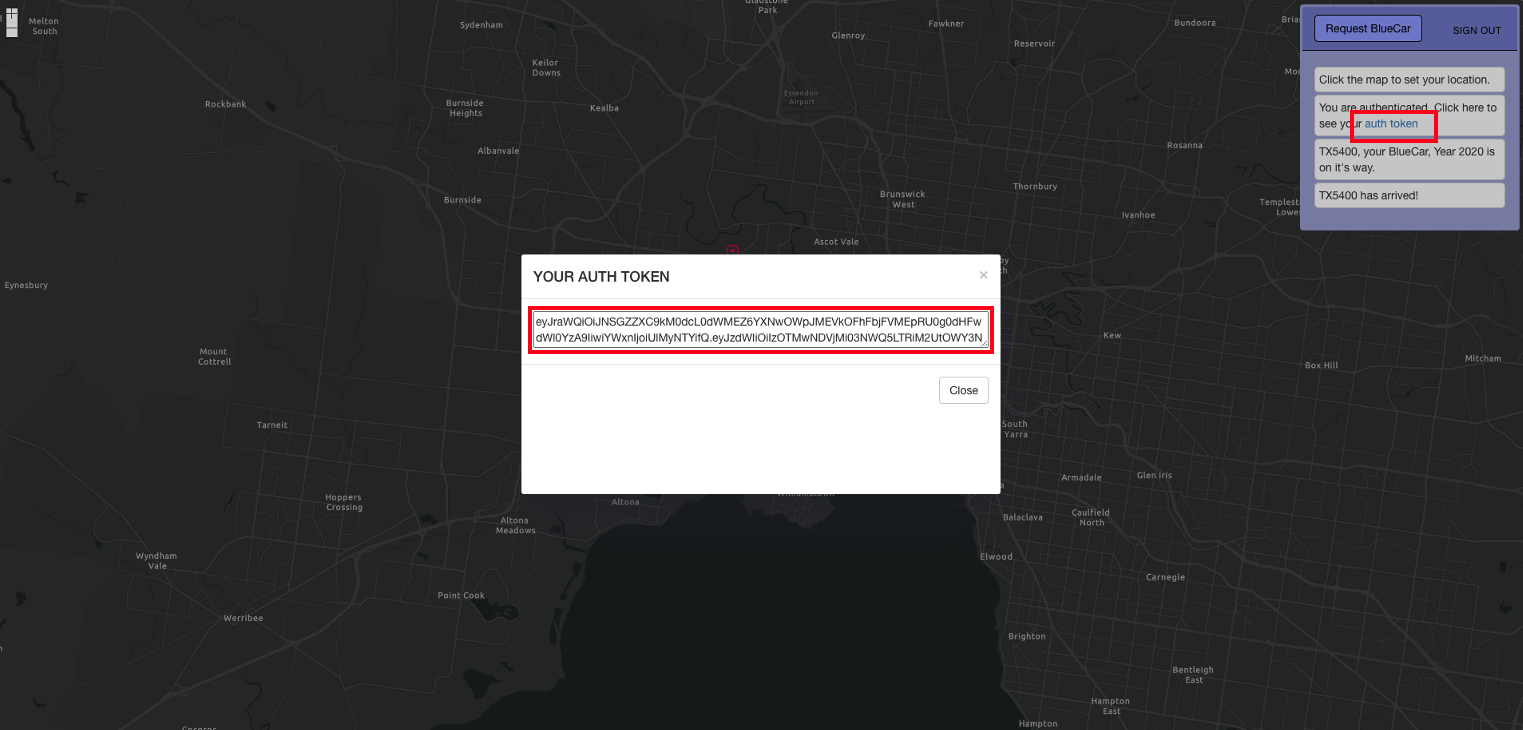
- From the Blue Car Application, click auth token to see the valid token. Copy YOUR AUTH TOKEN as shown.
3.2. Update the API Invoke URL and Auth Token to perform a load test.
Artillery is one of the most popular open-source tools for load testing serverless API. You will configure the number of requests per second and test duration.
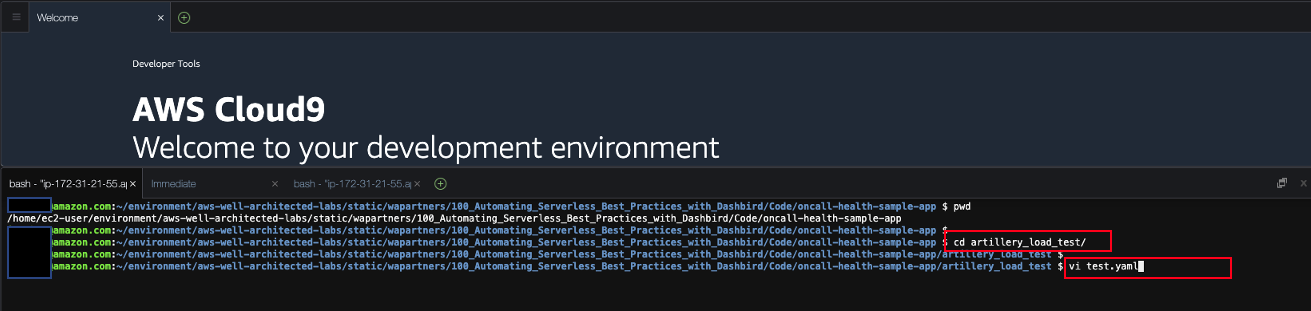
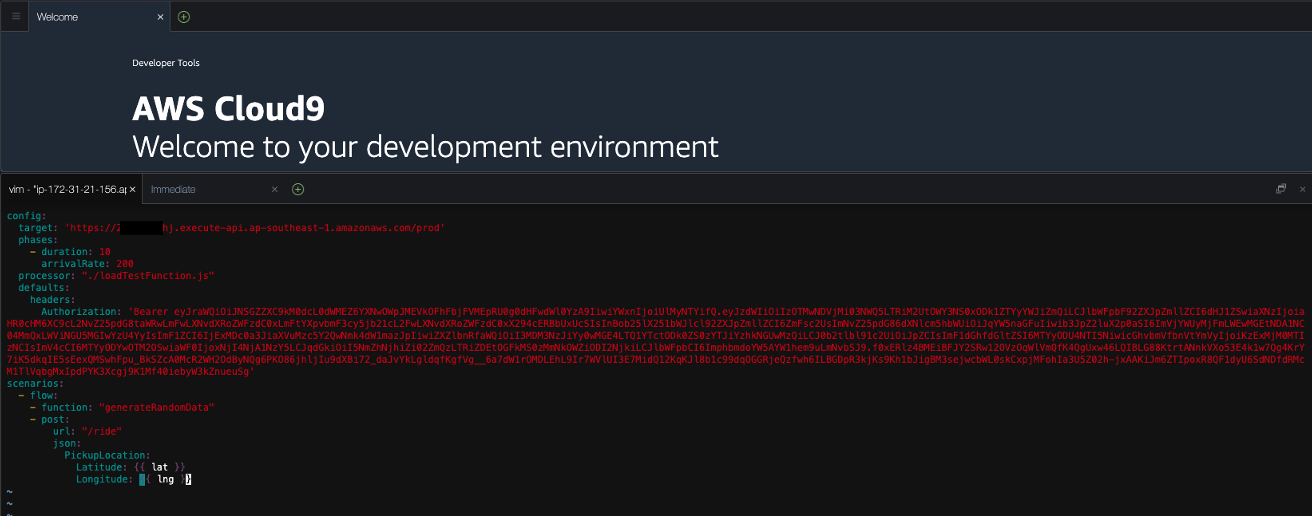
- In Cloud9, open test.yaml in altilery_load_test directory. Please ensure you are still in aws-well-architected-labs/static/wapartners/100_Automating_Serverless_Best_Practices_with_Dashbird/Code/oncall-health-sample-app/
cd artillery_load_test/
vi test.yaml
- We will need to replace API Invoke URL and Auth Token with the values you have generated. The current configuration is set to 200 requests per a second over a 10-second duration.
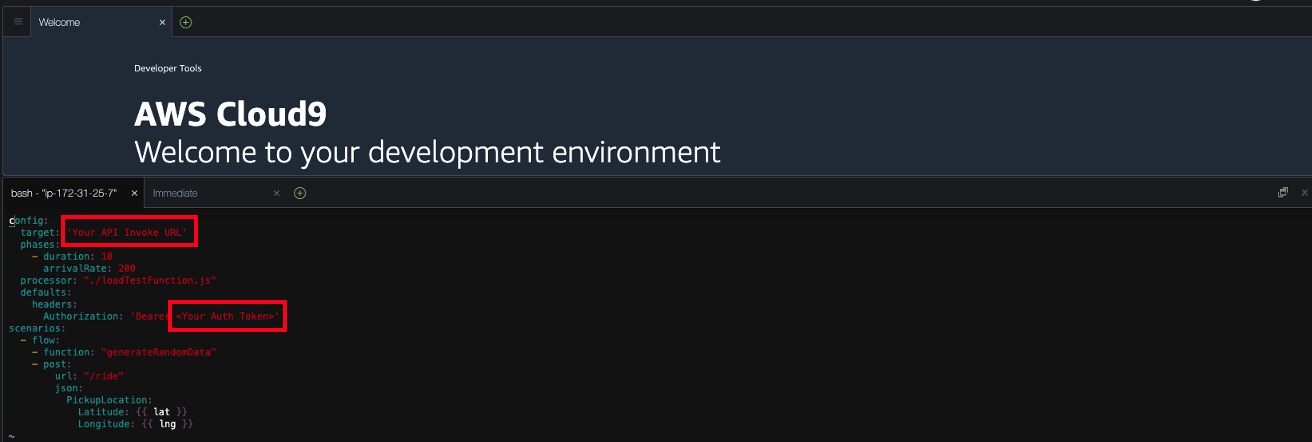
You should be seeing test.yaml as shown:
Run load test by running artillery cli with test configuration as shown below. Run this cli 2-3 times and check to see that no 5xx errors are generated.
artillery run ./test.yaml
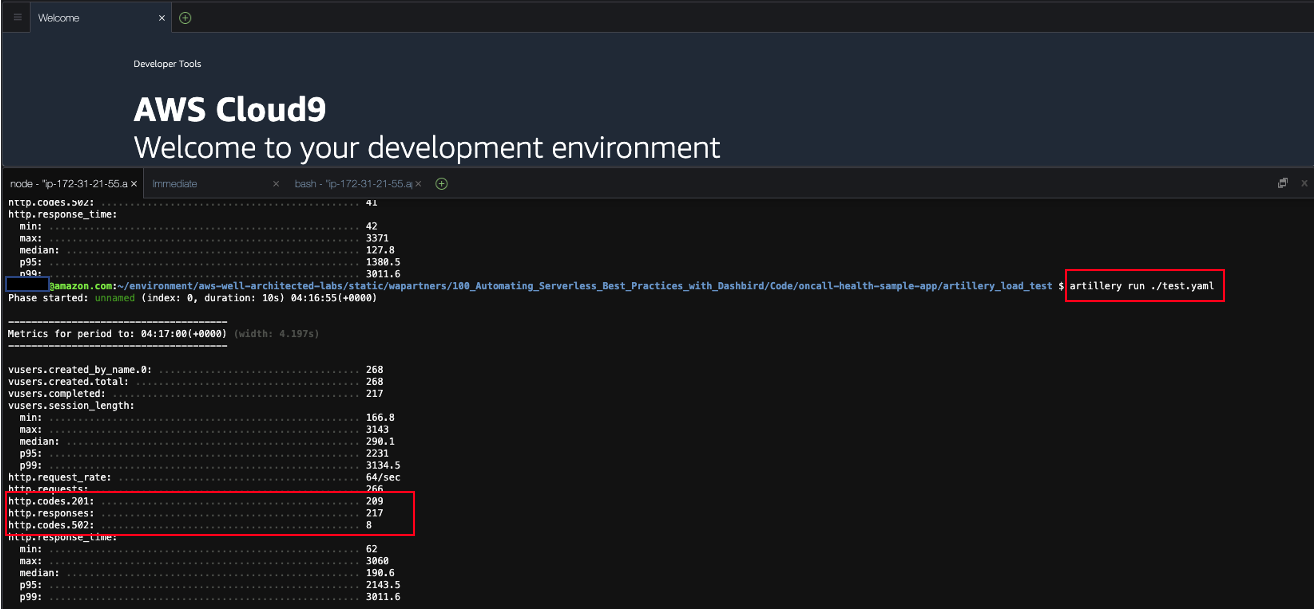
Note: If you see 4XX error, your auth token probably has expired.(Access token expiration: 60 minutes) You can refresh the blue car application and get a new auth token by clicking auth token. Please update auth token correctly in test.yaml.
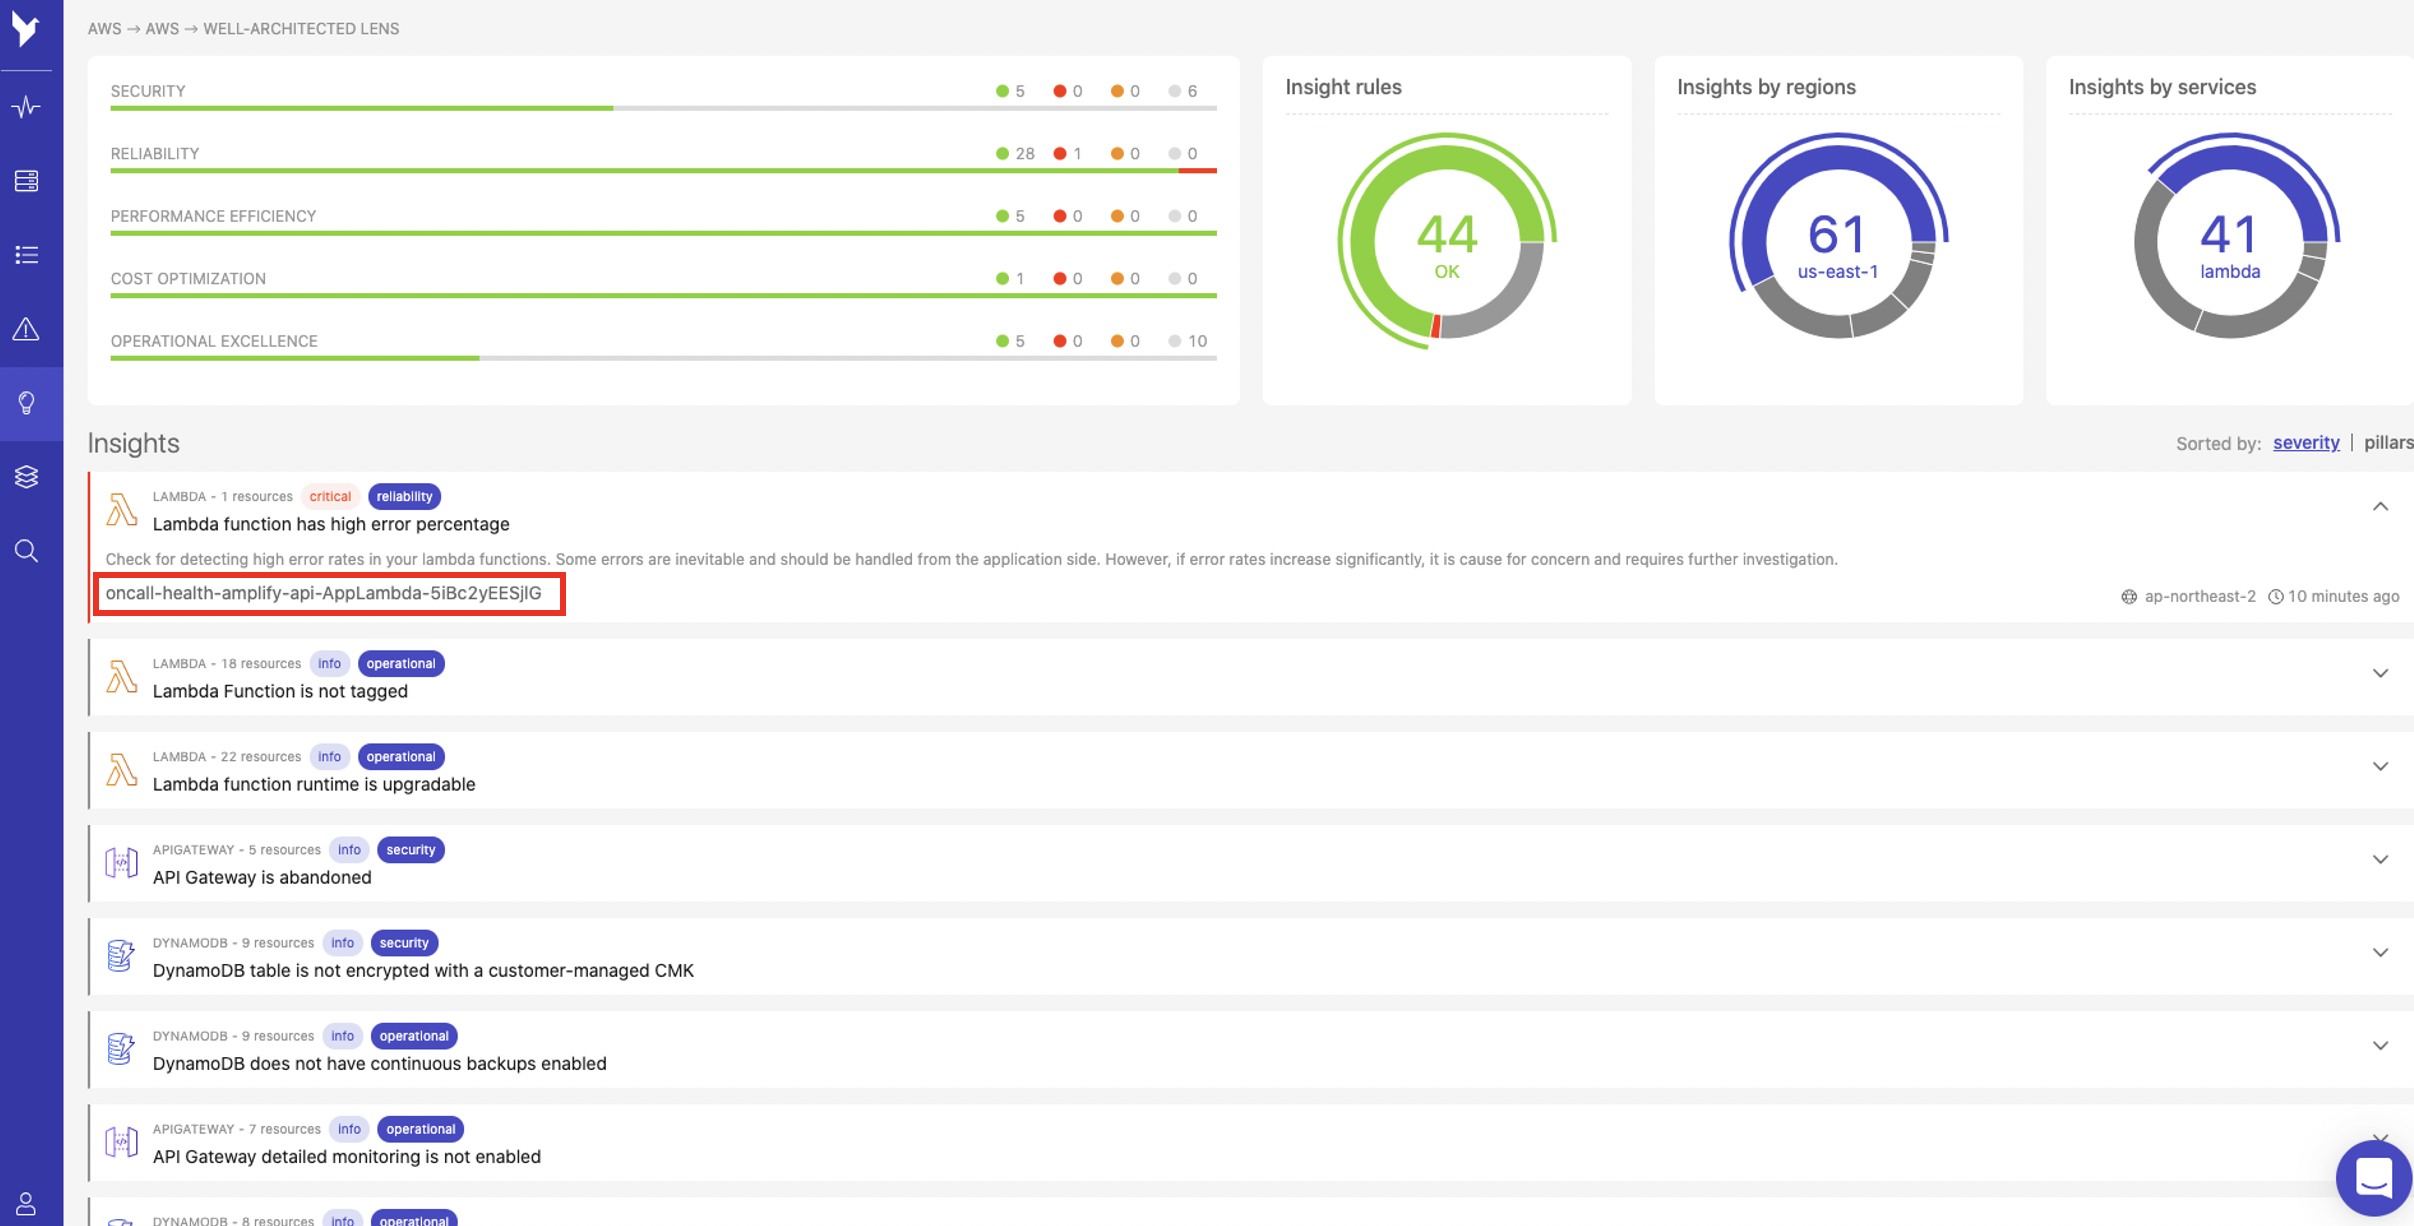
- As shown below, Dashbird should now identify a new insight. Click the insight labelled oncall-health-amplify-api-AppLambda as shown:
- You will be redirected to the Events page where you can see the event details associated with the insight. Select the event labelled oncall-health-amplify-api-AppLambda as shown:
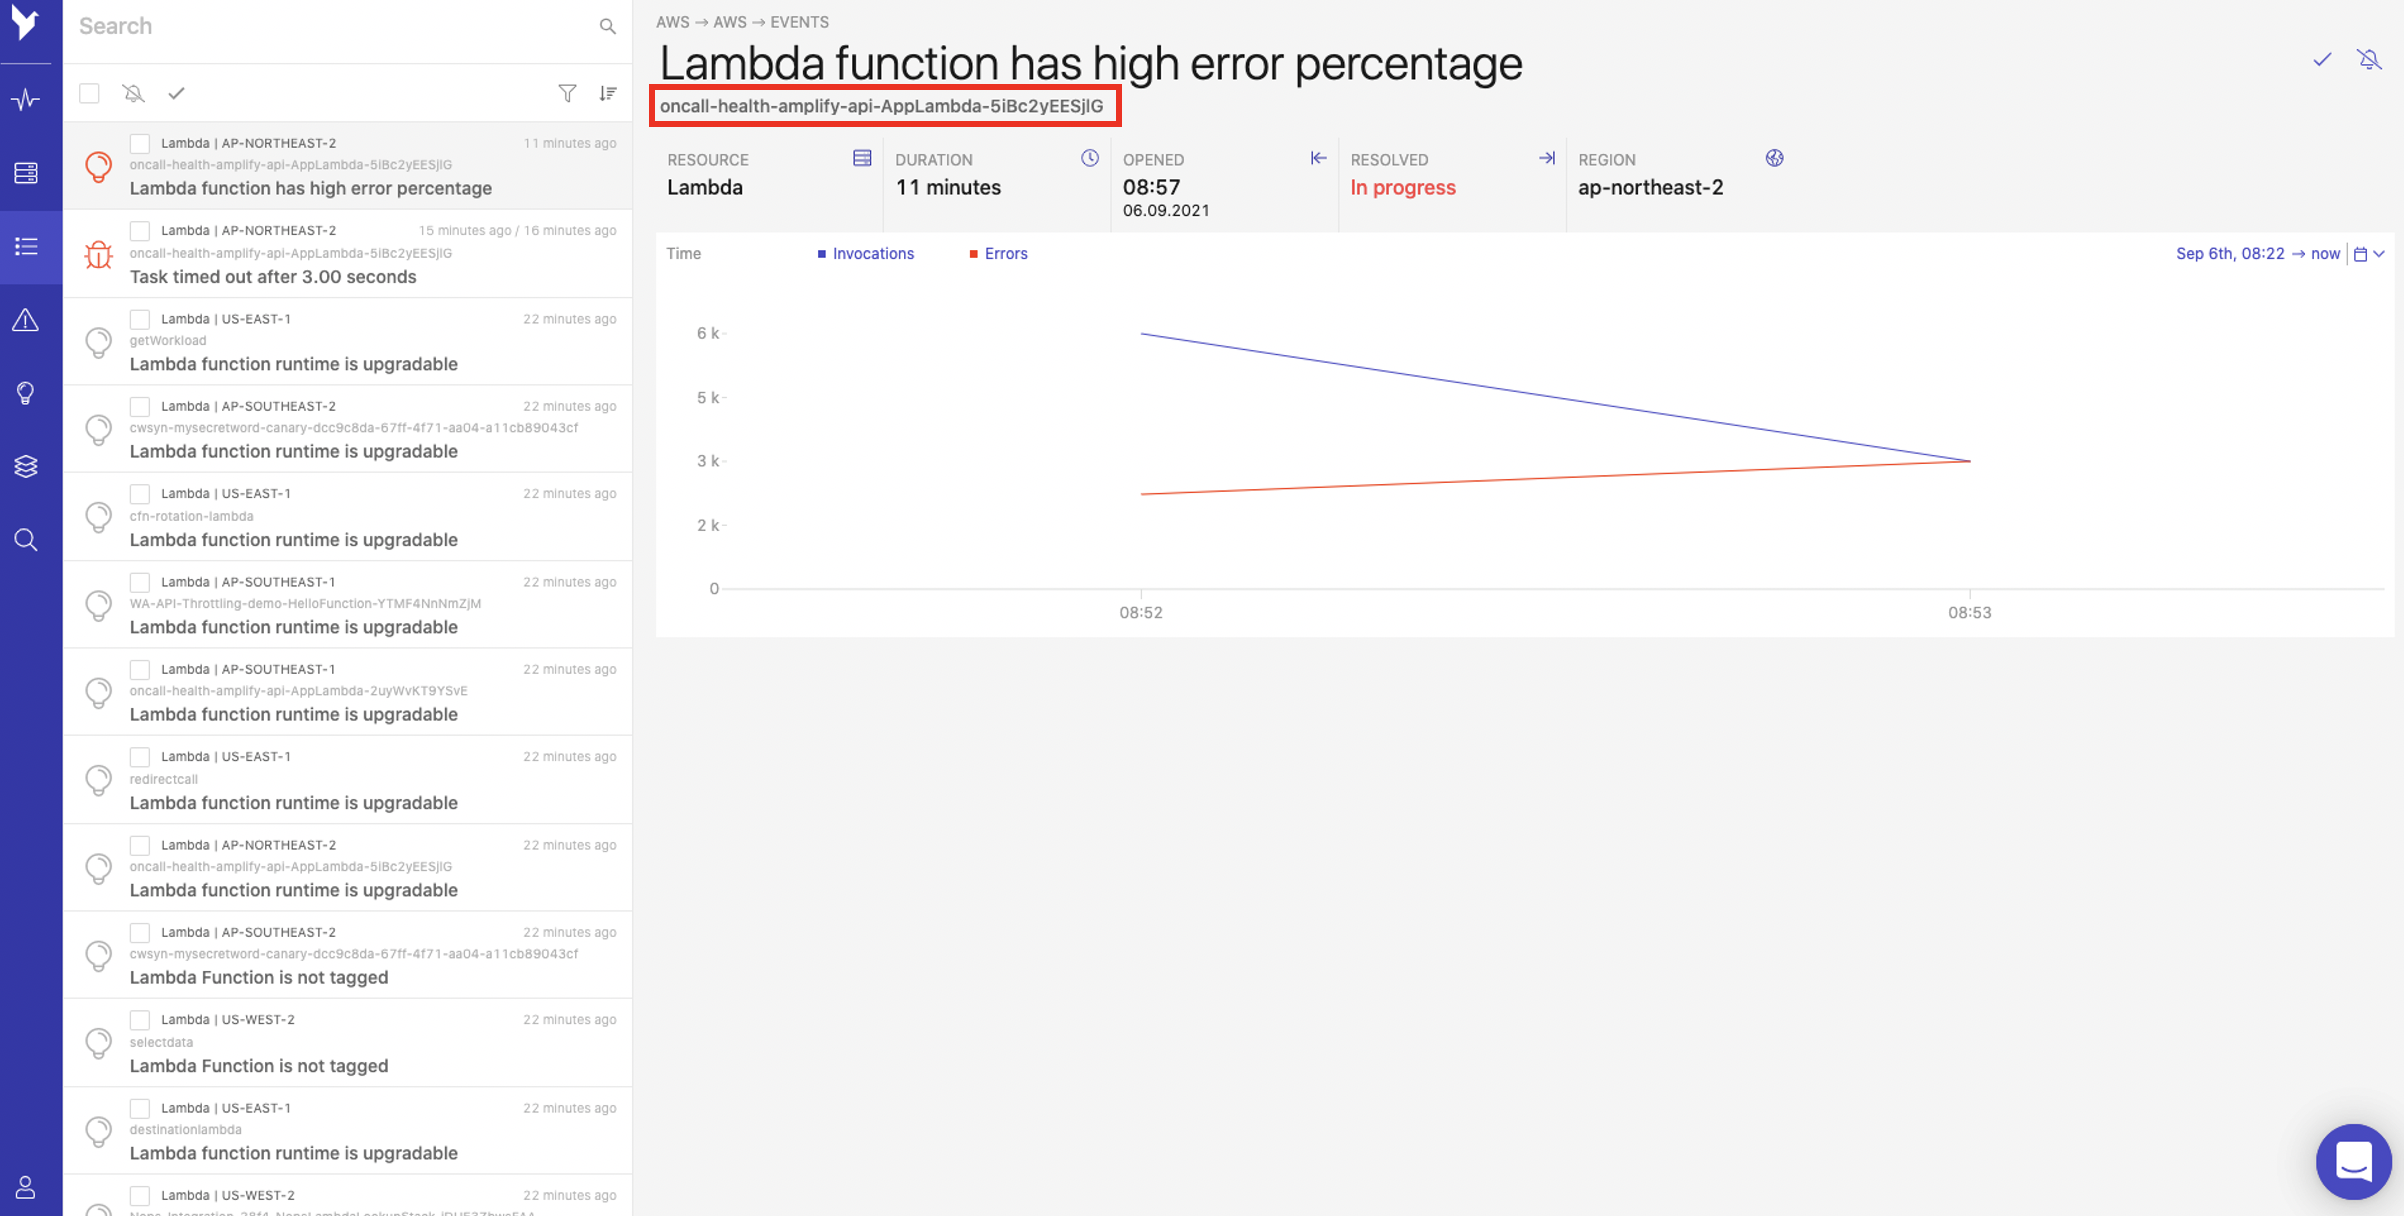
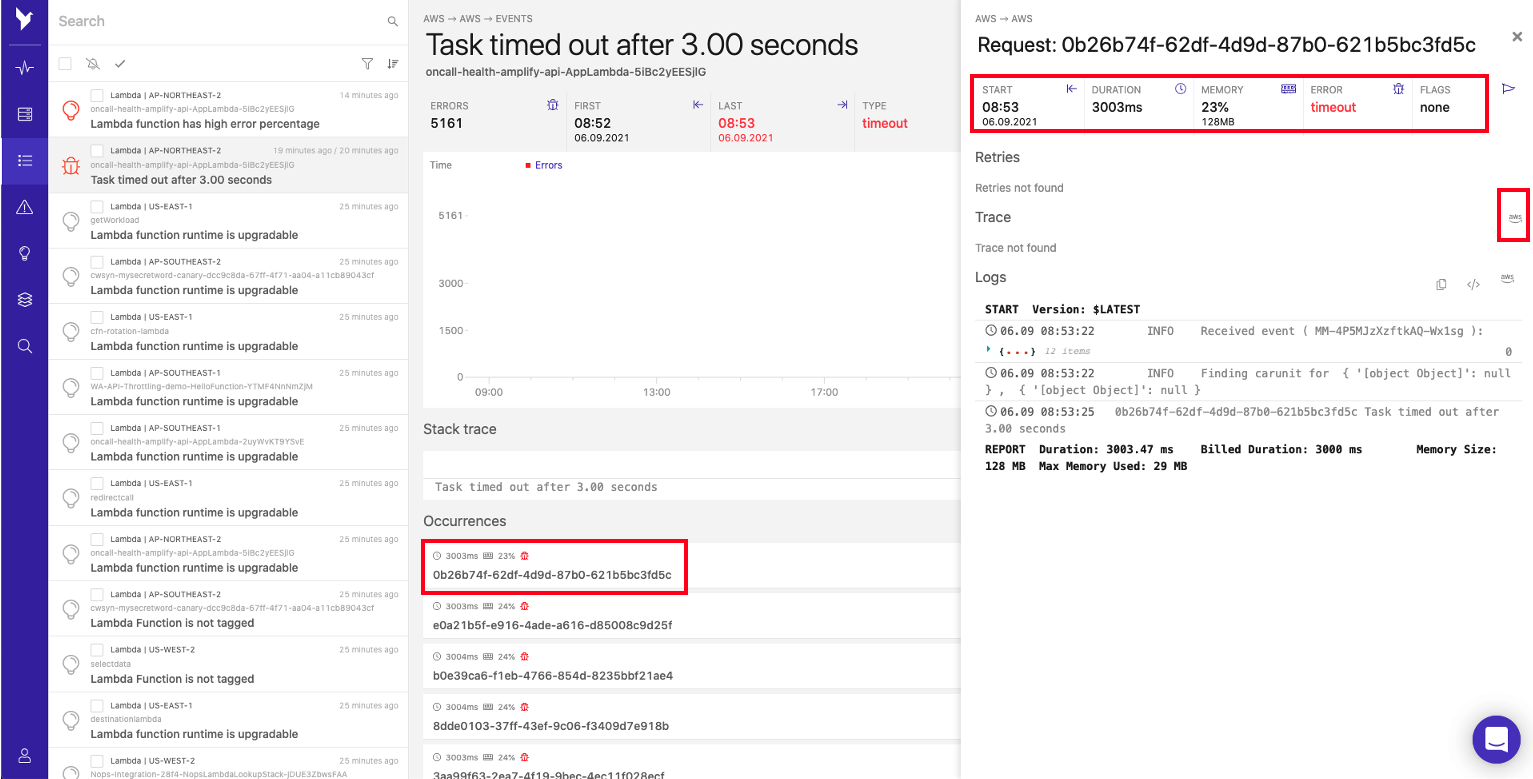
- You will see the error labelled as Lambda function has high error percentage. Click Task timed out after 3.00 seconds to see further error details.
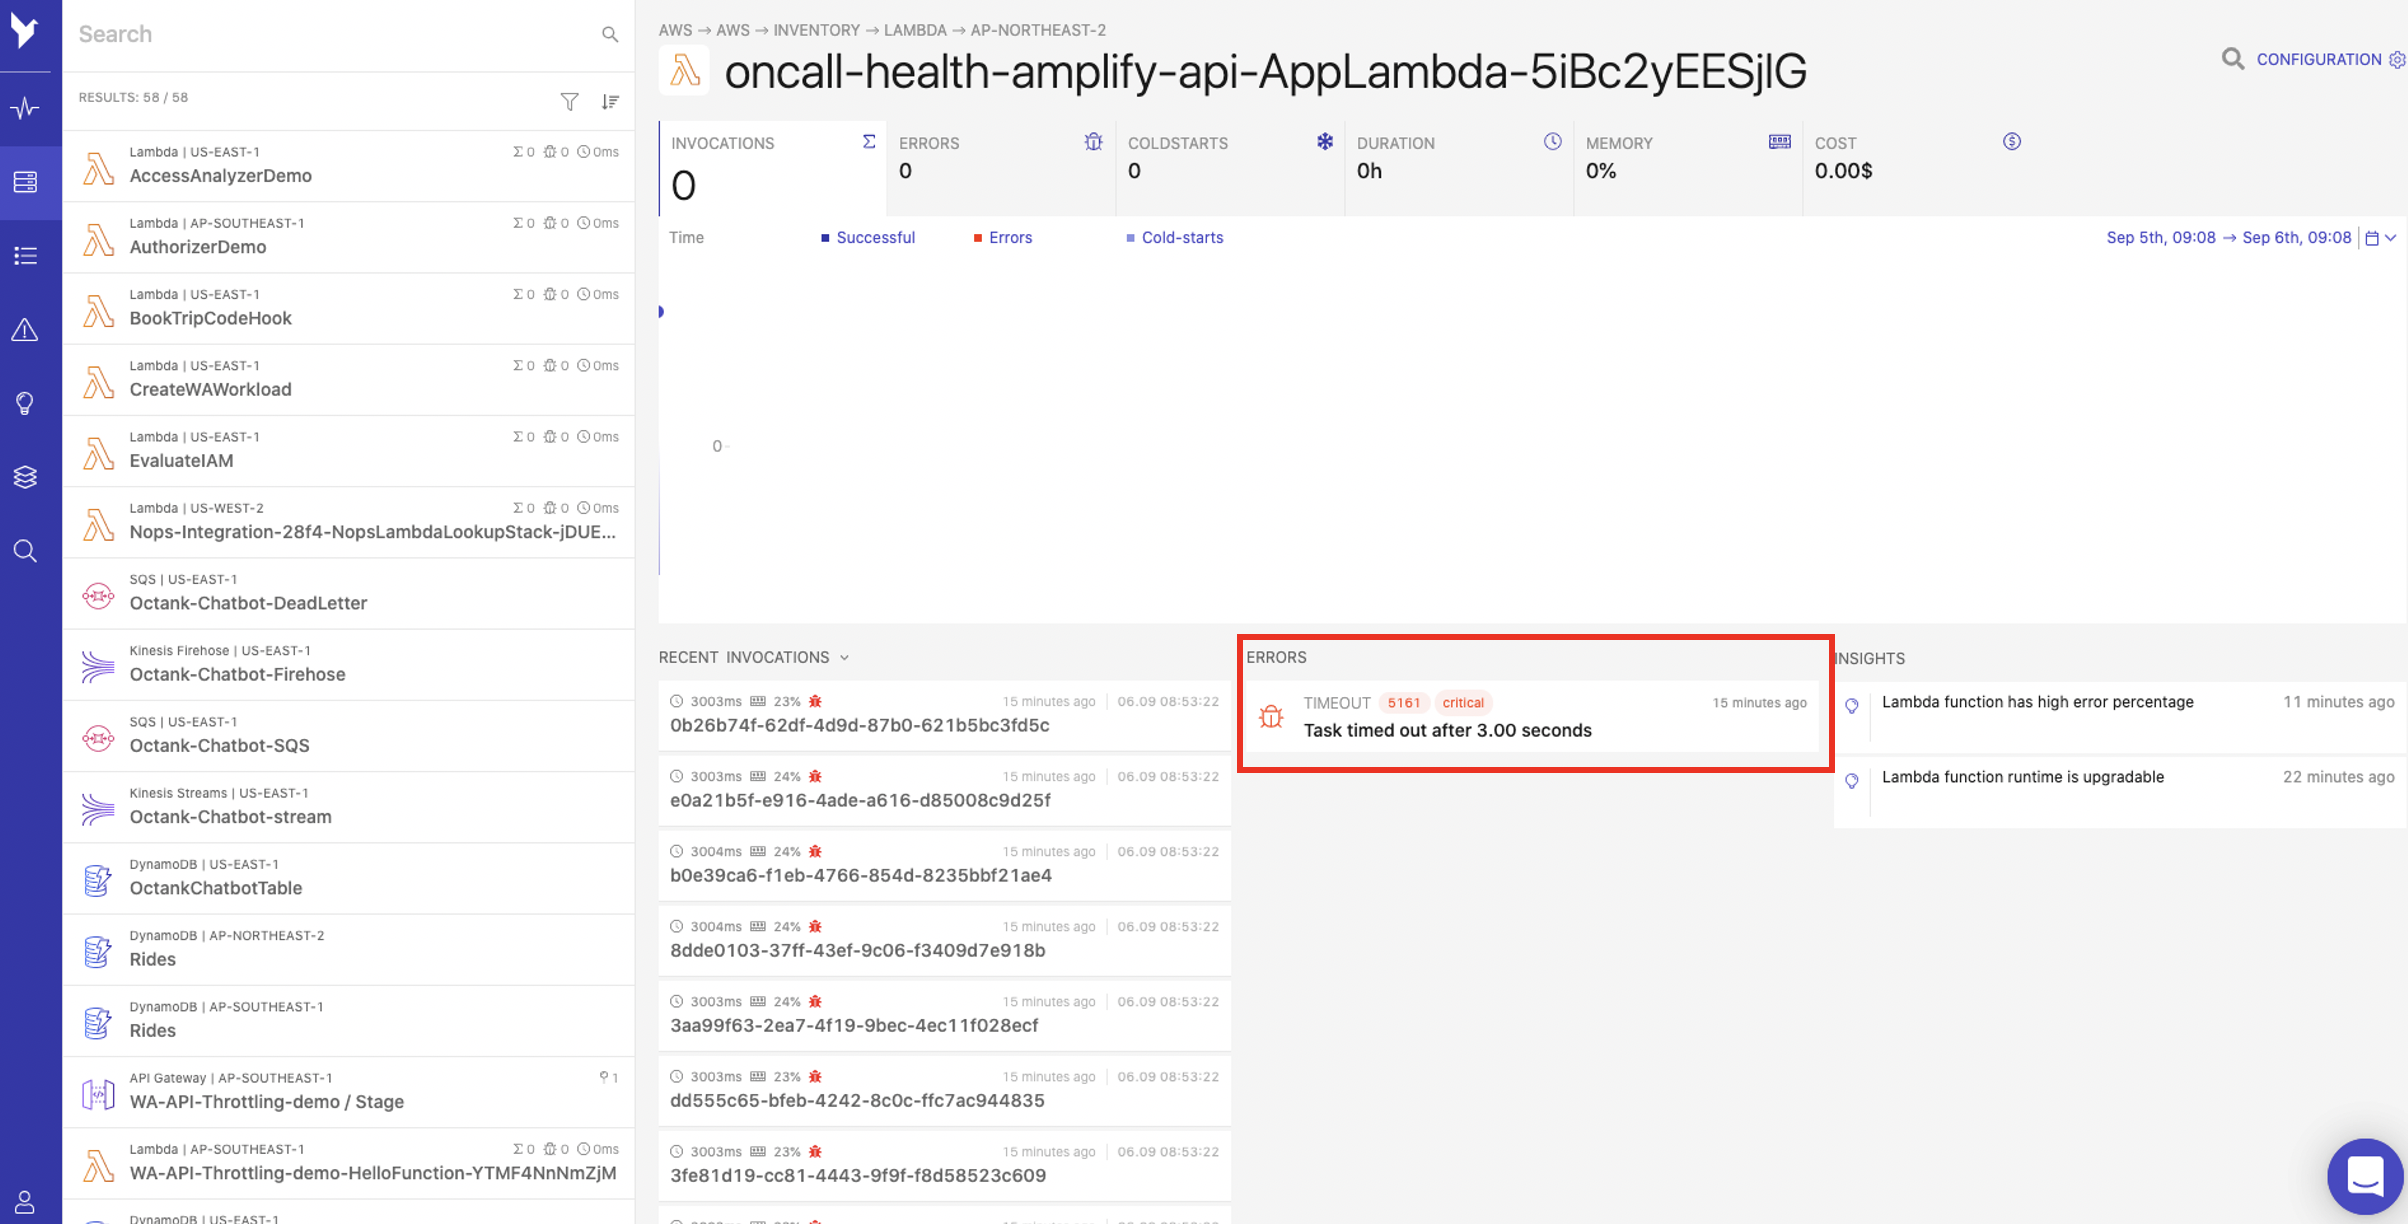
- You will be able to note that multiple occurrences of the error have occurred. Select one of the occurrences to show the Lambda related statistics such as duration, memory usage, errors and logs. As you can see in the example, the memory utilization is less than 30% of 128MB, so we can confirm that the timeout issue was not related to memory shortage within the Lambda. Now click the aws logo located in the Trace field to debug and analyze our application using AWS X-Ray.
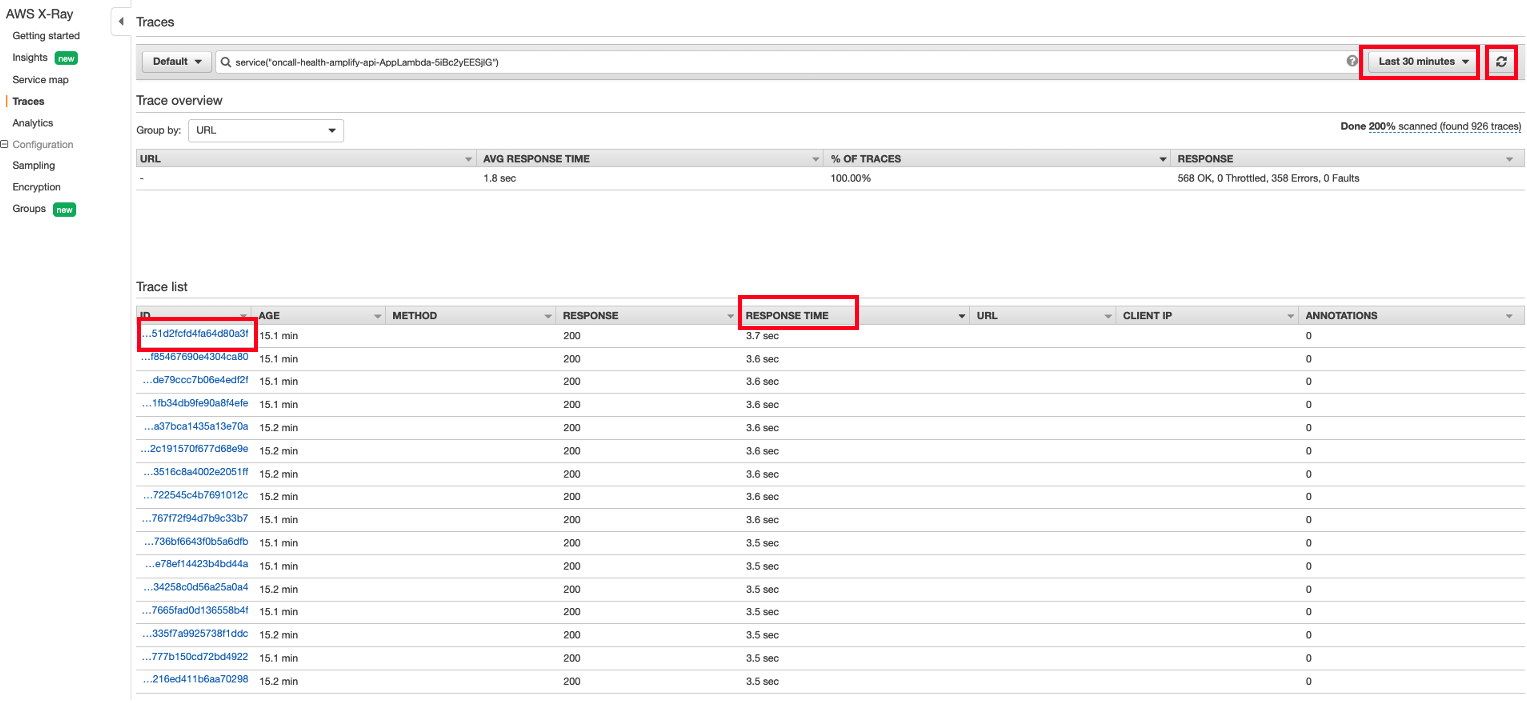
- From the trace window, configure the view to display the Last 30 minutes and click RESPONSE TIME Tab. This will display Trace IDs that took more than 3 seconds to be completed. Click one of Trace IDs to view further details as shown.
- You can now view the total time length required for the lambda to be initialized and run. The total duration of the Lambda function shown below appears to be more than 3 seconds. As there is no Overhead shown, we do not have an issue with the Lambda Initialization. However, we can see that most of the run time has been spent on Invocation and we do not see any operations related to DynamoDB. This could indicate that DynamoDB may not be ready to respond to a new Lambda request. Click Traces to have a look at other Trace IDs that were successfully completed in 3 seconds.
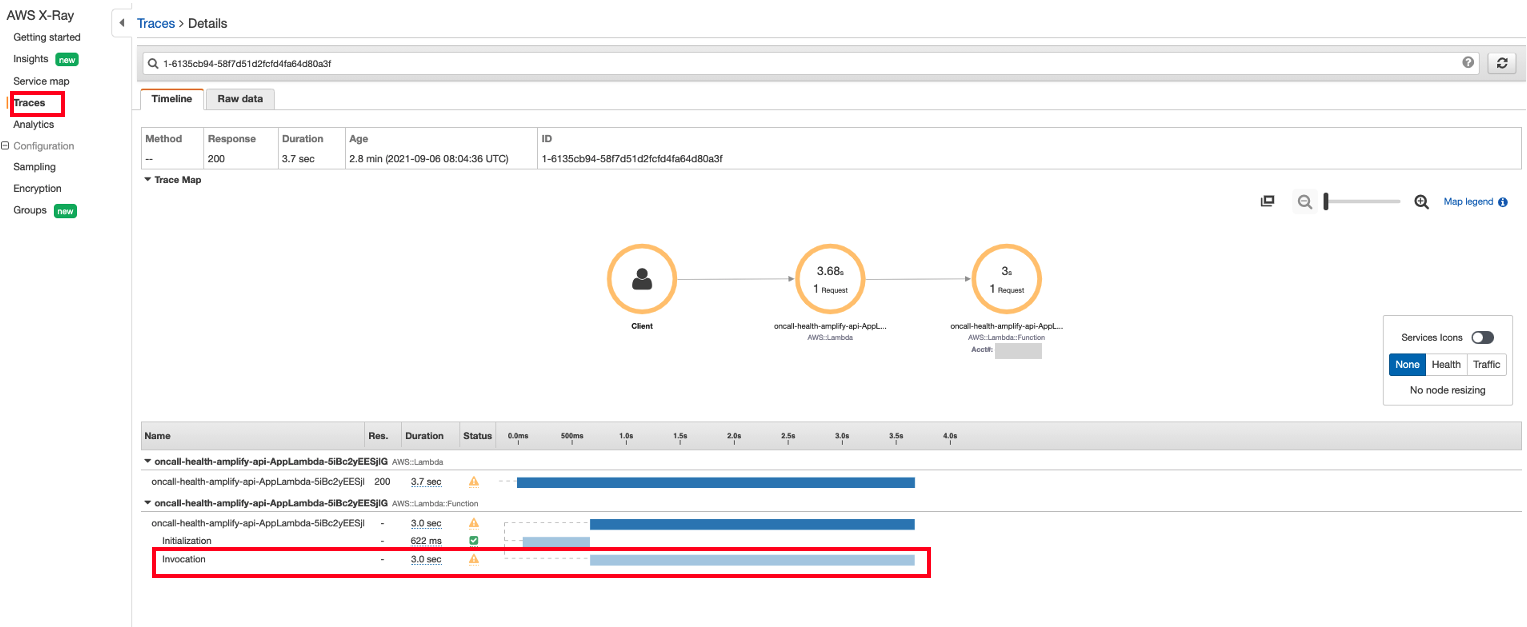
The Initialization subsegment represents the init phase of the Lambda execution environment lifecycle. During this phase, Lambda creates or unfreezes an execution environment with the resources you have configured, downloads the function code and all associated layers, initializes extensions, initializes the runtime and runs the function’s initialization code. The Invocation subsegment represents the invoke phase where Lambda invokes the function handler. This begins with runtime and extension registration and ends when the runtime is ready to send the response. The Overhead subsegment represents the phase that occurs between the time when the runtime sends the response and the signal for the next invoke. During this time, the runtime finishes all tasks related to an invoke and prepares to freeze the sandbox.
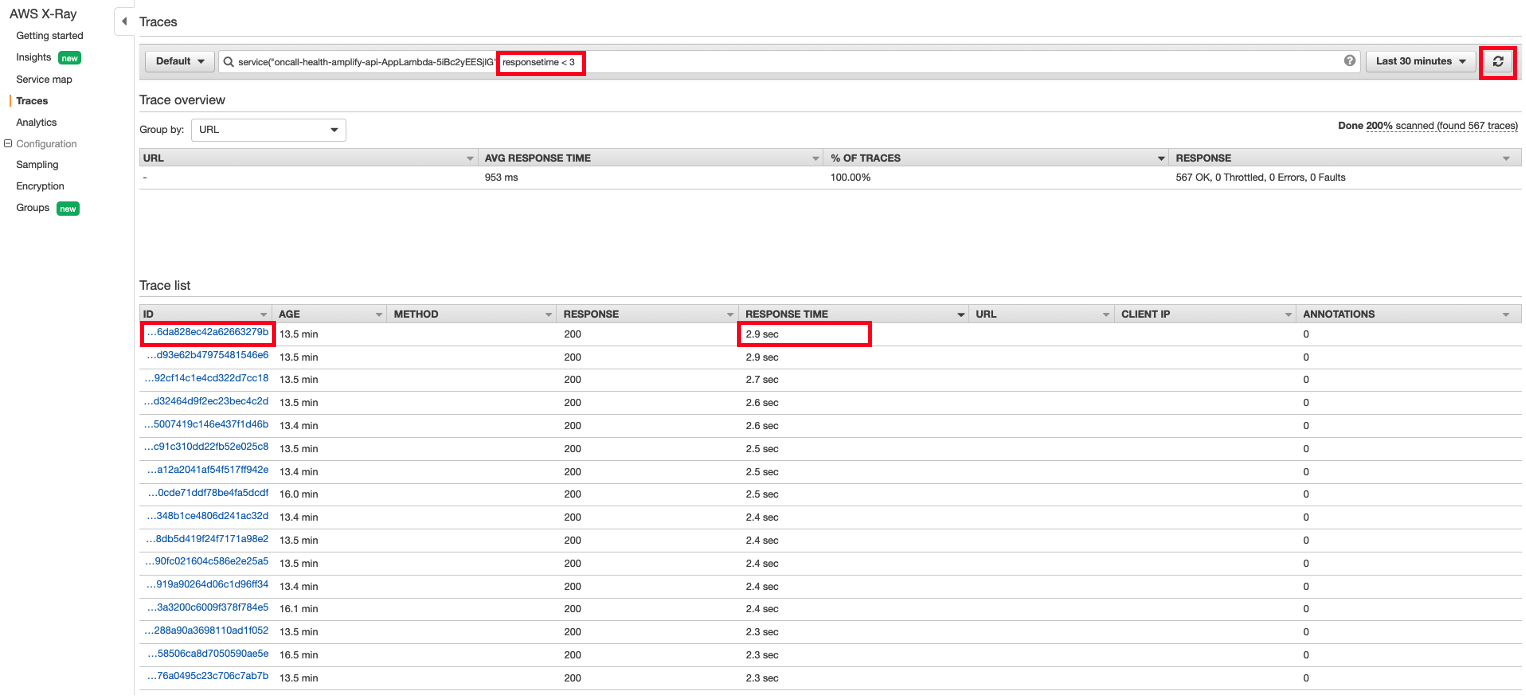
- Now add responsetime < 3 in search bar to sort by response time and click RESPONSE TIME Tab. Select one of Trace IDs that has 2.9 seconds as shown:
responsetime < 3
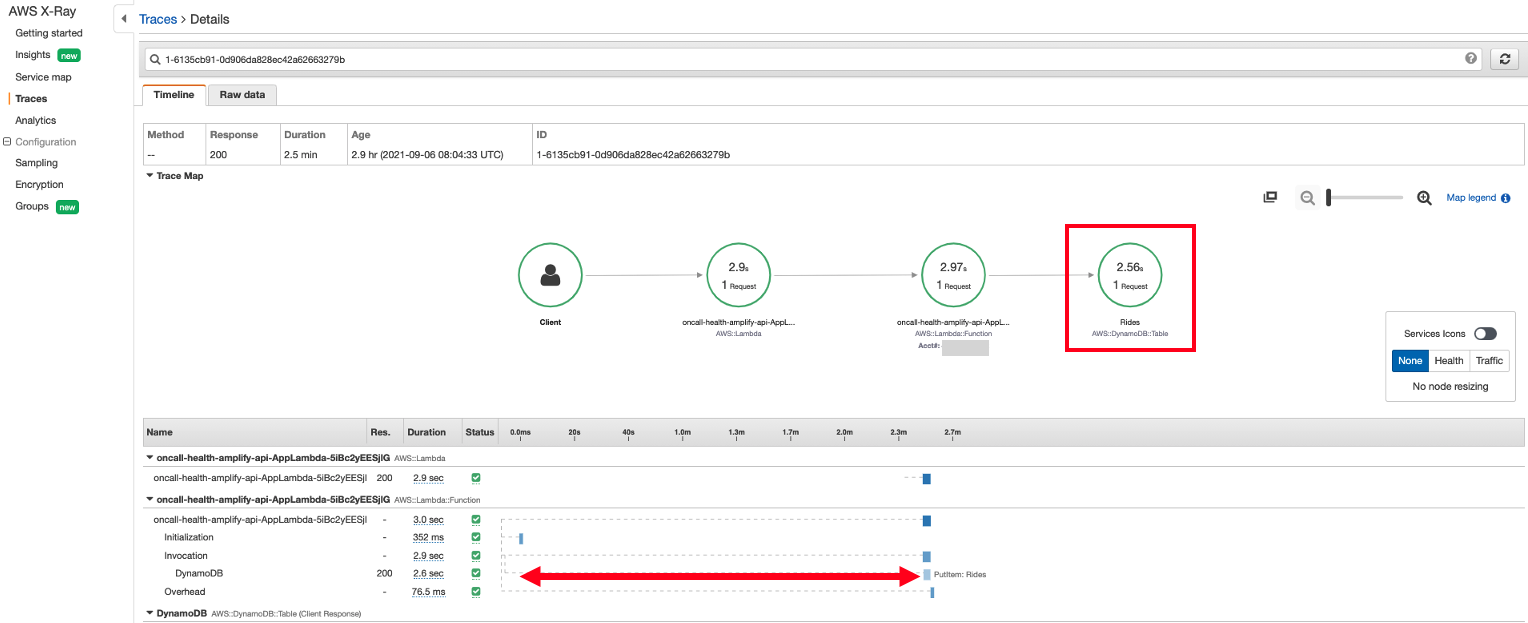
- The Lambda function has succesfully added items to the DynamoDB table. However, within the Invocation subsegment, we found that the Lambda function was waiting for the majority of the 3 seconds of the actual response time to put item into DynamoDB which only takes a few milliseconds. This indicates that DynamoDB may not have enough write capacity to put new items requested by Lambda after its initialization subsegment which could indicate our underlying issue. Let’s go to DynamoDB and see if we can get more information there.
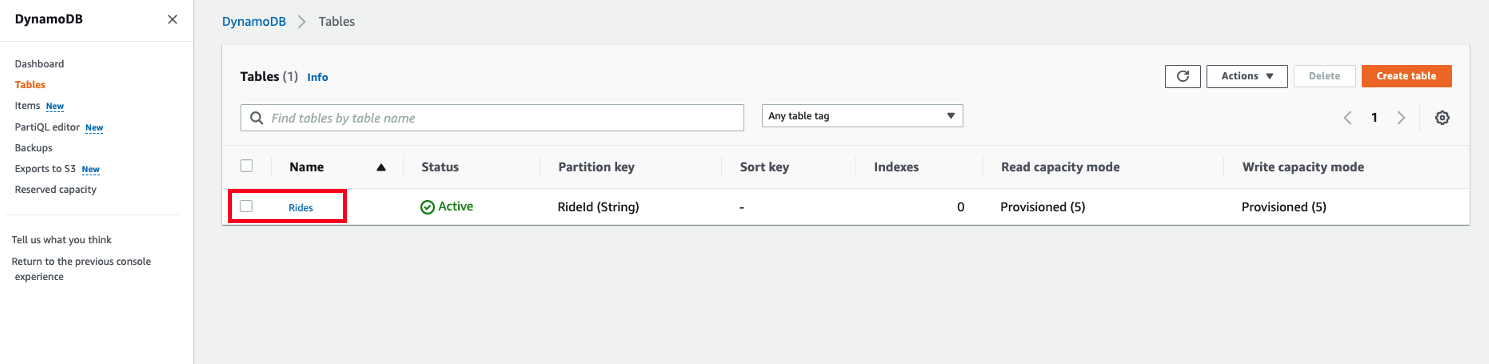
- From the DynamoDB console, select the tables view and click Rides.
- In the Overview tab, DynamoDB provide Table capacity metrics. As you can see from the below screenshot, there are a high number of Write throttled requests triggered by DynamoDB. The throttling behaviour from DynamoDB explains why the Lambda function spent most of its time in a waiting state.
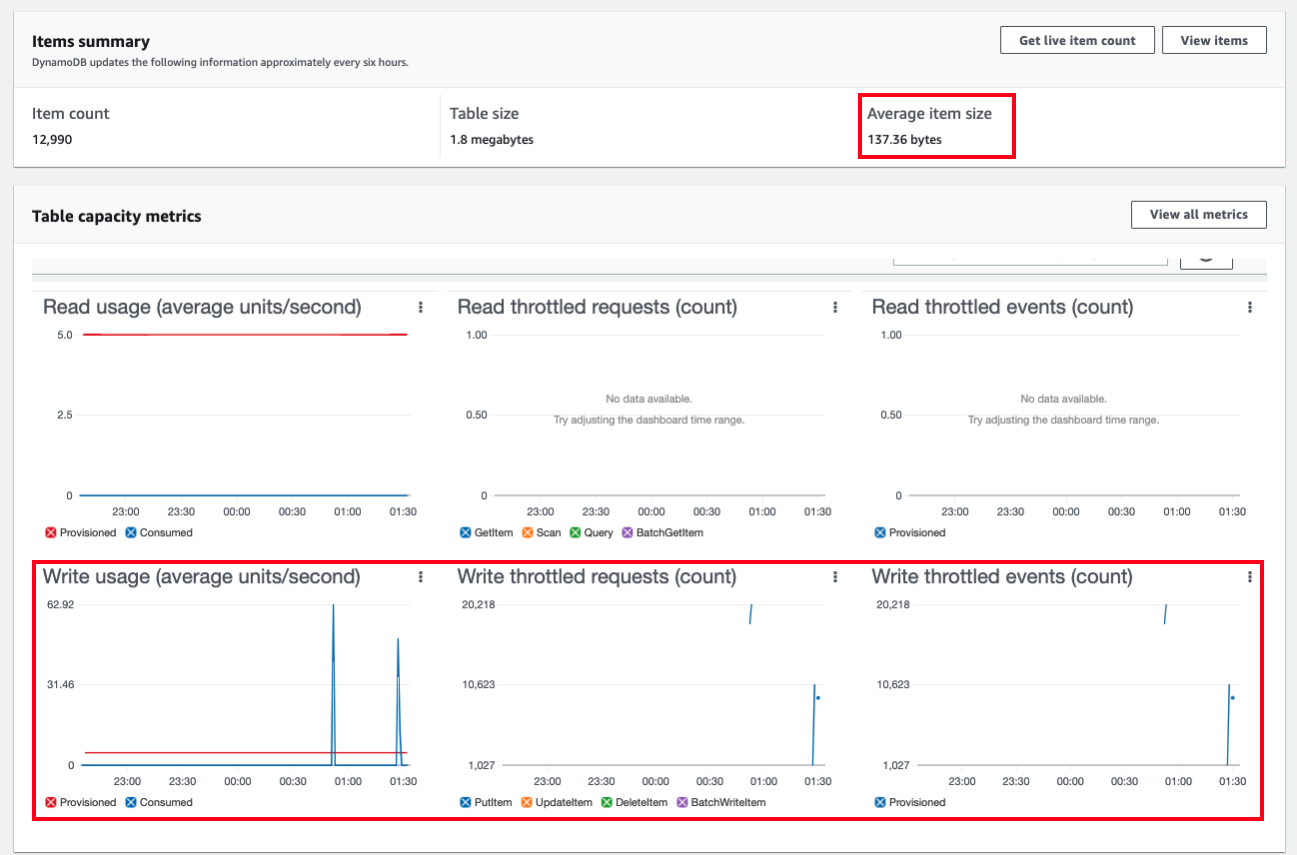
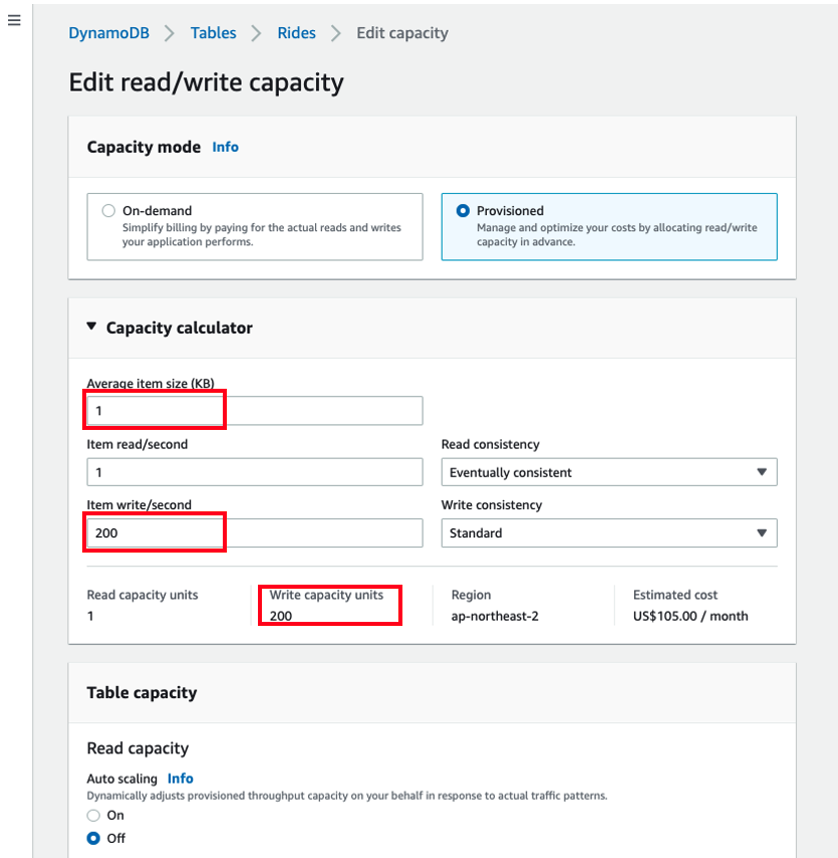
Take a note of Average item size to calculate the appropriate write capacity unit. However, DynamoDB updates the following information approximately every six hours. Average item size for this lab will be 137 byte. Let’s use this size.
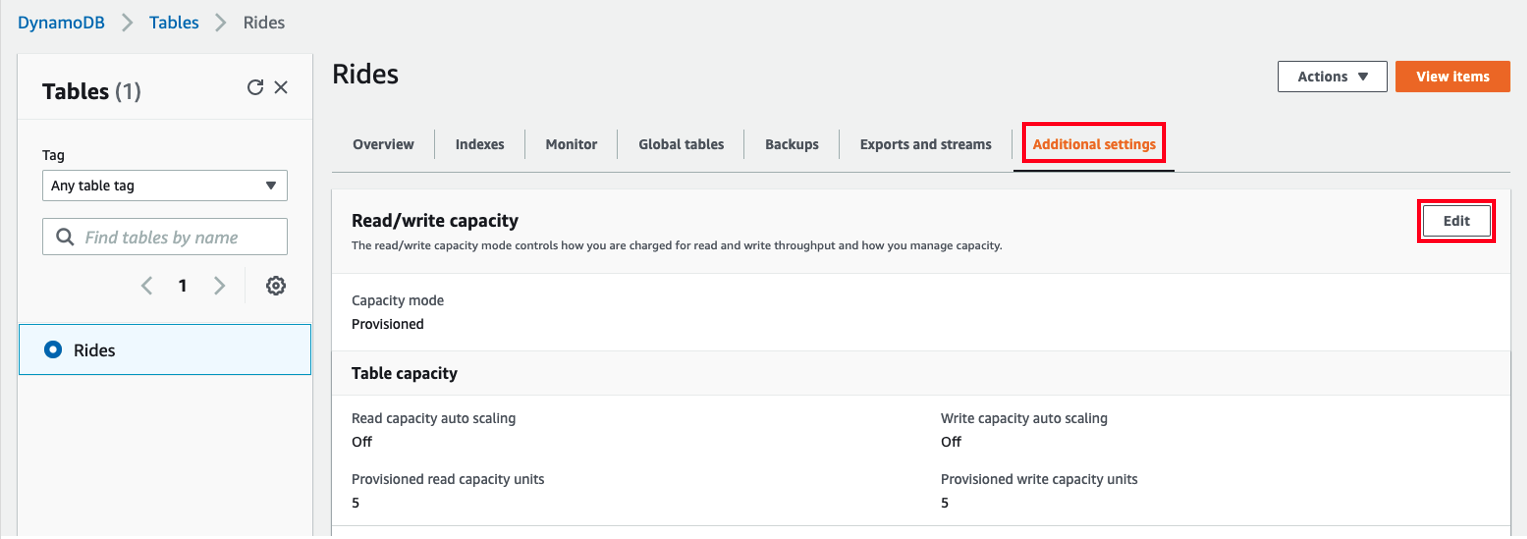
- To address the throttling, go to the Additional settings and select Edit to enable DynamoDB auto-scaling.
- In Capacity calculation, we can calculate the Maximum Write capacity units based on Average item size and the number of item write per second. Use the previously recorded Average item size and 200 write items per second. If so, you will get 200 Write capacity units. Again, this is Maximum Write capacity and DynamoDB will dynamically adjust the provisioned capacity.
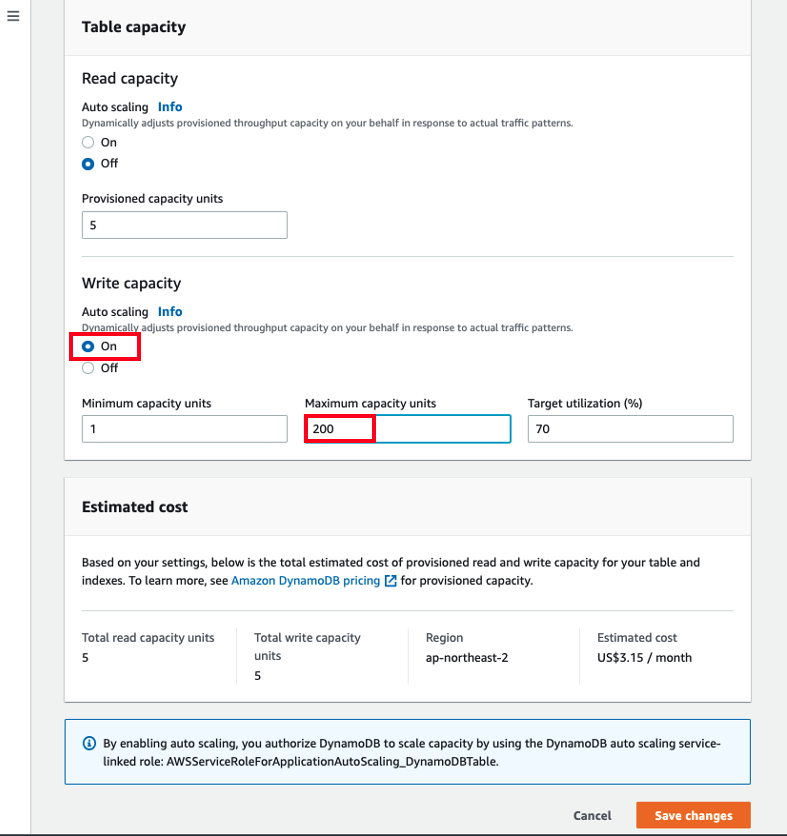
- Our test ultimately reached a peak of 200 write requests per second but we do not consistently write this amount of write. Hence, we will configure Auto scaling that dynamically adjusts provisioned throughput capacity on our behalf, in response to actual traffic patterns under monitoring. Auto Scaling enables us to effectively eliminate the guesswork involved in provisioning adequate capacity. Please see Managing Throughput Capacity Automatically with DynamoDB Auto Scaling and check the estimated cost before you enable auto scaling.
NOTE: You will be billed for any applicable AWS resources used if you complete this lab that are not covered in the AWS Free Tier.
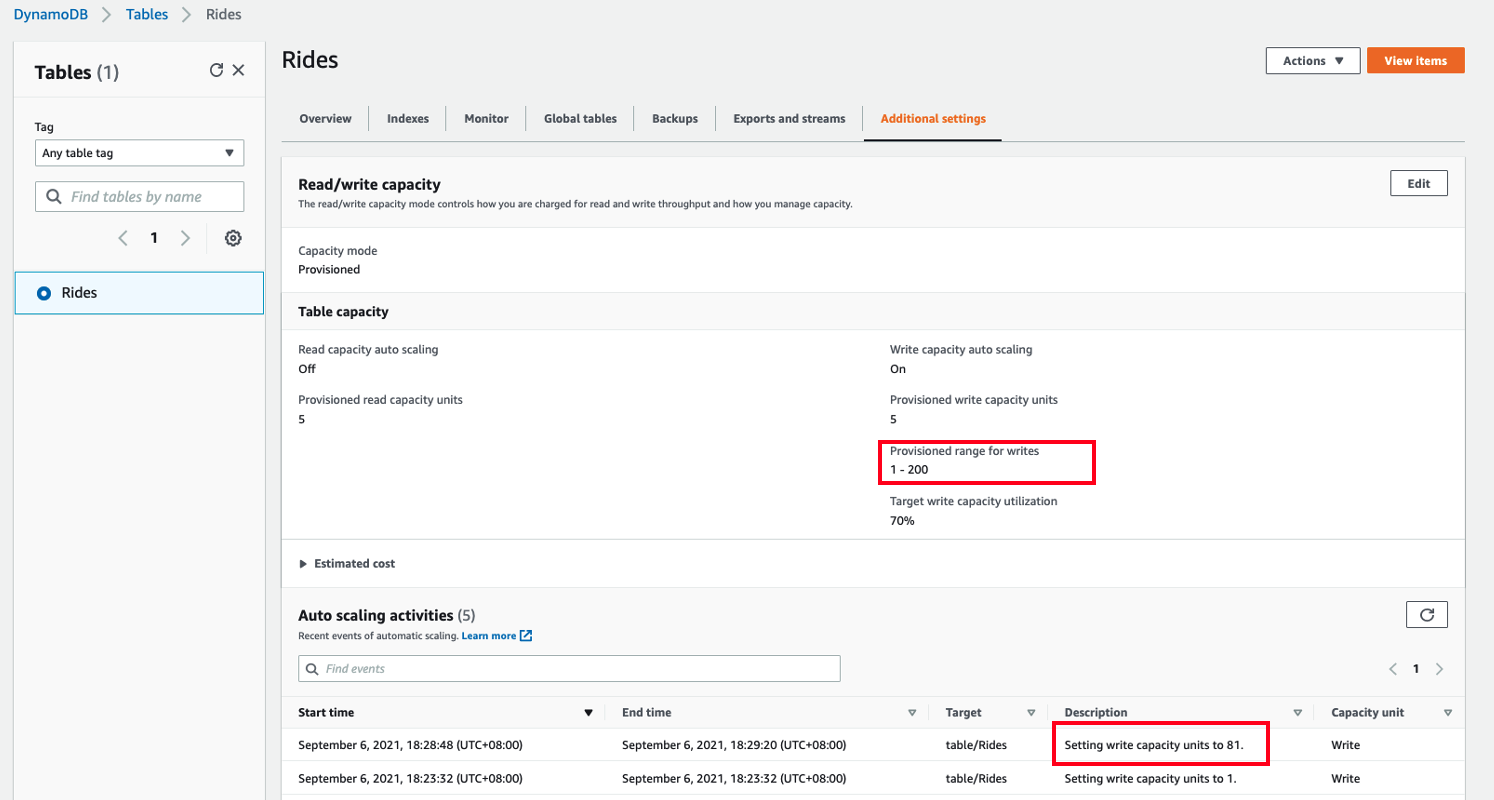
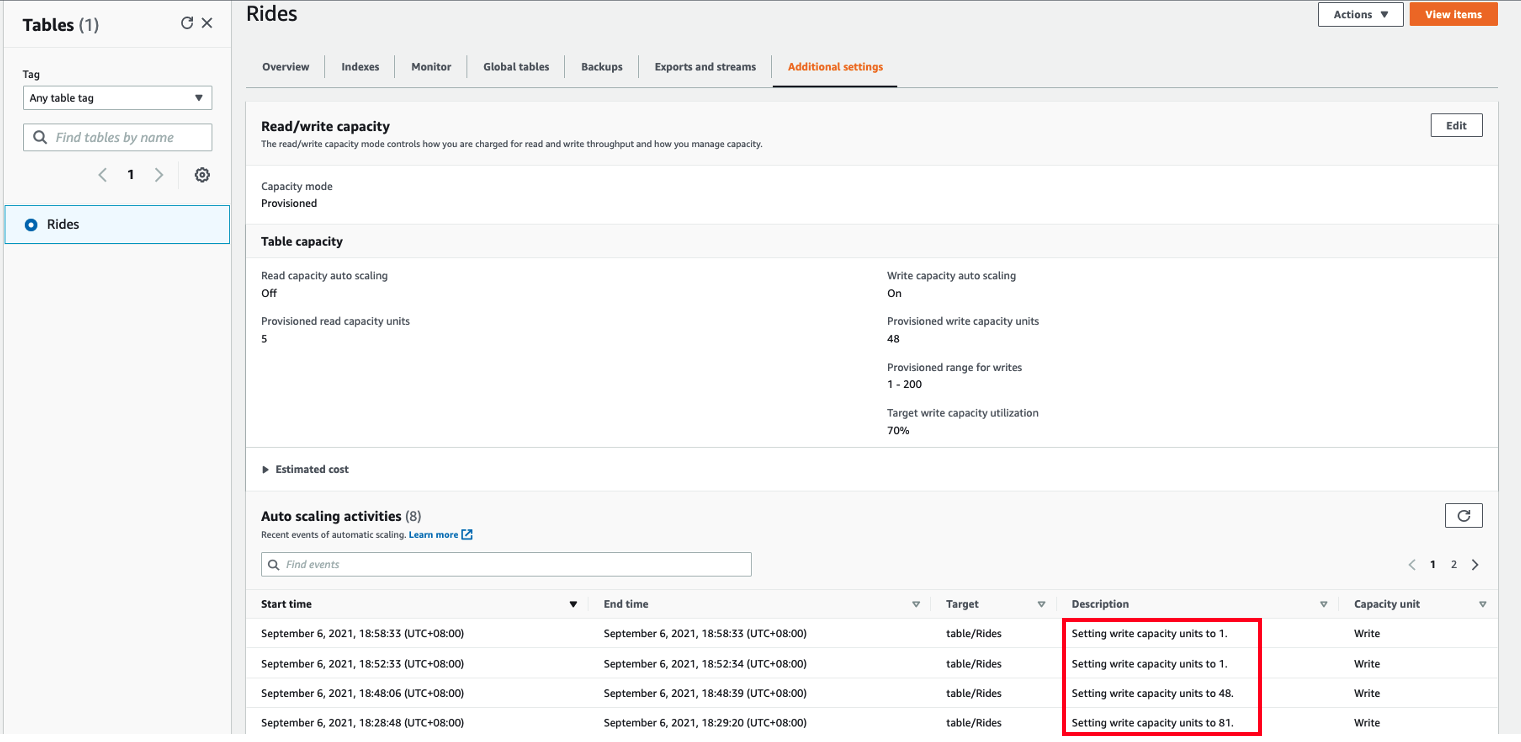
- DynamoDB auto scaling will modify provisioned throughput settings only when the actual workload stays elevated (or depressed) for a sustained period of several minutes. After running the workload test multiple times for a minute in cloud 9, DynamoDB auto scaling increased write capacity units from 1 to 81 based on the actual workload. You should be seeing Auto scaling activities in Additional settings.
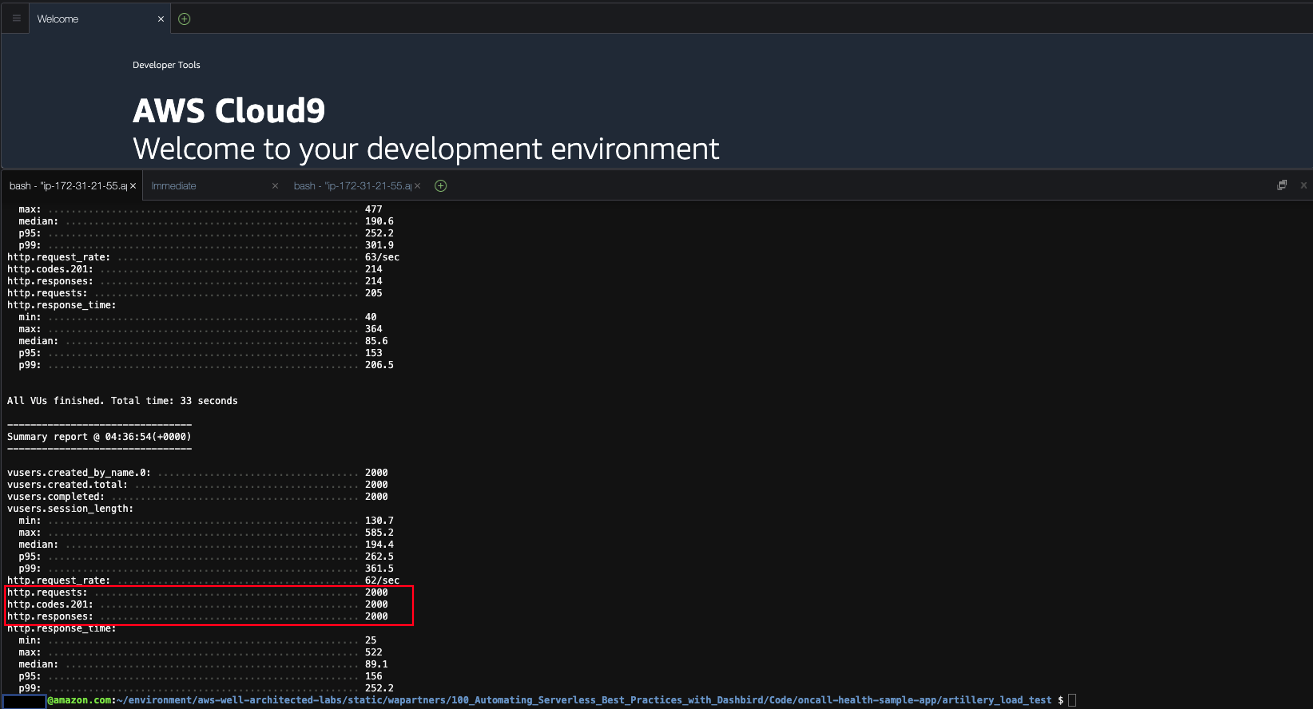
- If you perform the same load test a few times, 5xx errs will be gone. Now I am able to put all 2000 items with 201 response. If you see 4XX error, please update auth token correctly in test.yaml as your auth token has expired.
artillery run ./test.yaml
- Once you stop testing, DynamoDB auto scaling will automatically scale down the write capacity units to 1.
END OF SECTION 3